Understanding xG (Expected Goals) in Modern Football
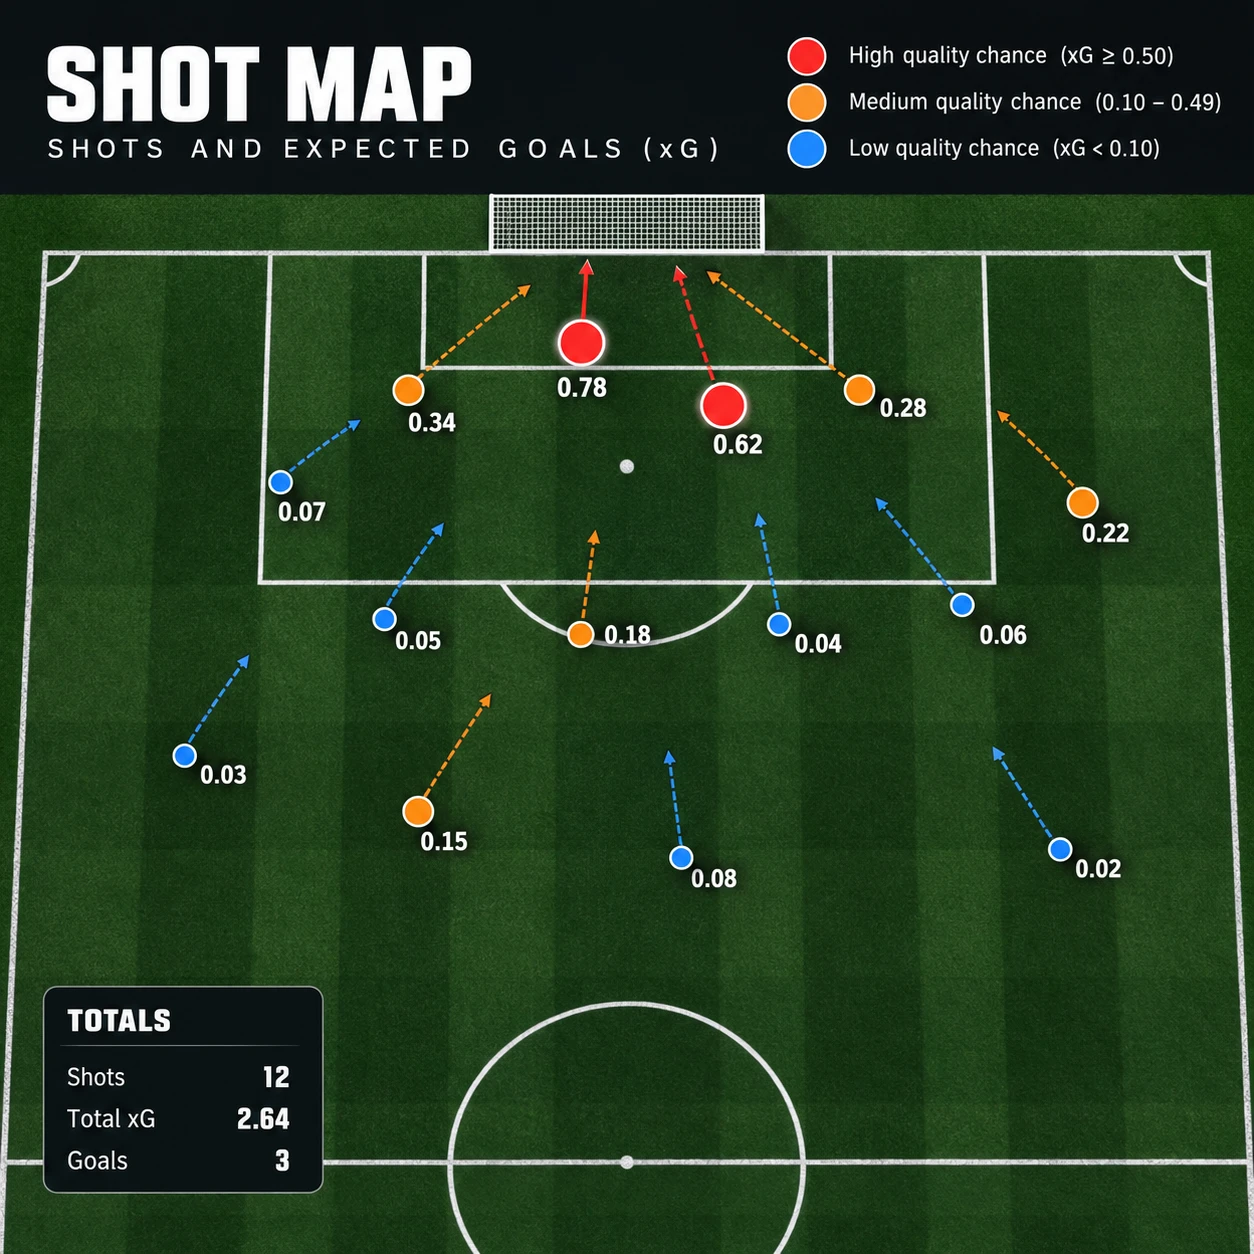
Expected goals, usually shortened to xG, gives football fans a way to look beyond the scoreline and consider the quality of the chances a team created. It estimates how likely a particular shot was to become a goal, based on patterns in comparable attempts. Read carefully, xG can add useful context to match analysis. It is not a prediction of what should have happened, or a verdict on who deserved to win.
What does xG mean?
Expected goals (xG) is an estimate of the probability that a shot will result in a goal. A shot assigned 0.20 xG had an estimated 20% chance of scoring according to the model used.
The value describes the chance before its outcome is known. If the shot goes in, it still counts as one actual goal; if it is saved or misses, it remains an attempt with the same xG value. Across a match, a team’s xG is usually the sum of the values assigned to its shots.
For example, a team that takes five shots worth 0.10 xG each has 0.50 total xG. Another team might create one close-range chance valued at 0.50 xG. The totals match, but the pattern of chances is different: one side generated several modest opportunities, while the other created one high-quality opening.
Think of xG as a **chance-quality summary**, rather than a score or a measure of effort. It helps answer how promising the shots were, but it cannot tell the whole story of the performance.
How is an xG value estimated?
An xG value is estimated by comparing a shot’s characteristics with outcomes from similar shots in a model’s dataset. Common inputs include shot location and shot type, though the exact factors vary between providers.
Shots taken closer to goal are often more likely to score than attempts from a tight angle or long range. Models may also account for whether a shot was taken with a foot or the head, whether it followed a cross or a through ball, and the situation in which it occurred. A penalty is typically treated separately from an open-play attempt because penalties are taken from a fixed spot under different conditions.
Imagine two shots from roughly the same distance. One is hit first time from a difficult angle with a defender blocking the route to goal. The other is taken centrally after a cutback, with the shooter facing the goal. Their locations may be similar, but the surrounding circumstances can lead a model to assign different probabilities.
Models are not identical. Providers may use different data, definitions, and features, so the same shot can receive different xG values on different platforms. When comparing matches or players, use figures from the same provider where possible. For a broad explanation of the metric’s history and use, see Wikipedia’s overview of expected goals, while remembering that the underlying models are provider-specific.
How to interpret xG in a match
A team’s total xG helps describe the quality and volume of the chances it created, but it does not determine the match result. Use it alongside the score, match events, and what happened on the pitch.
Suppose the score is 1–0, but the losing side finishes with 1.8 xG and the winner with 0.7. That gap suggests the losing team created more or better chances in the model’s assessment. It does not prove that the winner was lucky, that the losing side played better in every respect, or that the same result would occur if the game were played again.
Before drawing a conclusion, check how the total was built. Many low-value shots can add up to a respectable figure, while one missed one-on-one may account for a large share of a team’s xG. A quick match-analysis check is to ask:
- Did the team create several dangerous chances or rely on one major opportunity?
- Were its shots central and close to goal, or mostly from distance and difficult angles?
- Did the opposition also create strong chances that the scoreline hides?
xG is most useful here as a prompt for closer analysis. A high total with few goals invites questions about finishing, saves, and chance selection. A low total with a win may reflect clinical finishing or a small number of decisive moments. Neither pattern, on its own, explains the entire match.
xG versus actual goals
Actual goals record what happened; xG estimates the probability of each shot scoring. The two figures can differ because every chance has an uncertain outcome, and a single match contains relatively few shots.
A shot worth 0.30 xG is not a guaranteed goal. It represents an estimated 30% scoring probability for an attempt with comparable features. If it goes in, the player has scored; if it does not, the result remains possible within that probability. Across many attempts, the comparison between goals and xG can offer context about outcomes, but it should not be treated as a complete explanation of a player’s ability.
Finishing is one factor in the difference. A player may score more goals than their xG over a stretch by placing shots well or converting difficult opportunities. Goalkeeping also matters: a strong save can prevent a high-value shot from becoming a goal. Deflections, blocks, and the natural variation in shot outcomes affect the final tally too.
Be cautious about labeling a player “lucky” or “unlucky” after a handful of games. A short run may be driven by a few attempts. Longer-term comparisons are generally more informative, but xG still simplifies the skill and context involved in creating and finishing chances.
Using xG to assess teams and players
Over multiple matches, xG can help assess a team’s chance creation and vulnerability, or add context to a player’s goalscoring record. It is most informative when compared with actual goals and expected goals against (xGA) across a suitable run of games.
For a team, xG summarizes the value of its shots; xGA summarizes the value of the shots it allowed. Looking at both can reveal patterns the table does not show. A side that regularly produces strong chances while limiting the opposition’s opportunities may be performing differently from a side whose results depend on narrow wins and low-quality attempts. These figures still need context, including opponents, injuries, game state, and tactical changes.
For a player, comparing goals with xG can help frame whether their scoring record is broadly in line with the chances they have taken. It is not a standalone rating. A striker’s total may be shaped by minutes played, role, the quality of service, penalties, and whether the player takes difficult shots that teammates do not attempt.
- Team attack: Compare xG and goals over several matches to see whether chance creation and scoring outcomes differ.
- Team defence: Use xGA to examine the quality of chances conceded, not just goals allowed.
- Player evaluation: Pair xG and goals with minutes, shot volume, role, and match footage.
The practical rule is to use xG as a comparison tool, not a ranking shortcut. Consistent patterns across a longer sample deserve more attention than a single match’s total.
Limitations of xG
xG simplifies a complex scoring chance into a probability, so it cannot capture every detail of a shot or a player’s performance. It is valuable for analysis, but it should be read with match context and video rather than used as a replacement for either.
Two attempts can share a location and shot type while differing in ways a model does not fully capture. A defender’s pressure, the goalkeeper’s position, the shooter’s balance, or the speed and placement of a pass may change the difficulty. The details included depend on the model and the data available.
There are also limits to interpreting totals. A team can have high xG without controlling the game, and a lower xG does not mean it created no danger. Scoreline and game state influence decisions: a team protecting a lead may stop attacking, while a team chasing the game may take more shots from poor positions. Raw totals can hide those shifts.
Use xG to sharpen the questions you ask: where did the chances come from, how often did a team create them, and what changed over time? Then check the footage and other statistics. That combination gives a more grounded account than either the scoreline or one metric alone.
What does an xG of 0.5 mean?
An xG of 0.5 means the model estimates that a shot had a 50% probability of becoming a goal. It does not mean half a goal was scored, or that the attempt was certain to go in.
Is a higher xG always better?
A higher xG generally indicates that a team created shots with greater estimated scoring probability. It is not automatically better in every sense: the total may come from many weak attempts, a single chance, or a match situation that calls for a different style of play.
Can xG predict the final score?
No. xG can help describe the chances created, but it cannot guarantee a result or exact score. Shots have uncertain outcomes, and match events such as red cards, penalties, and tactical changes shape what happens.
What is the difference between xG and xGA?
xG estimates the quality of a team’s shots, while xGA (expected goals against) estimates the quality of the shots it concedes. Together they help describe attacking chance creation and defensive exposure, but neither replaces watching the match or considering its context.